
How pressure in South Africa’s manufacturing sector moves through supply chains, and what credit teams can spot before it turns into trade credit risk on their own receivables book.
South Africa’s economic contraction is raising questions for businesses that extend trade credit. When manufacturing, mining and trade come under pressure, the effects can spread through supplier networks, slow B2B payments and raise trade credit risk across a company’s accounts receivable book.
For credit managers, CFOs and finance teams, the challenge is understanding not only whether a customer can pay, but also how changing economic conditions affect credit risk.
South Africa’s factories are under pressure. GDP contracted 0.2% in the second quarter of 2026, ending six consecutive quarters of growth. Manufacturing contracted for a third consecutive quarter, falling 1.8%, while trade fell 1.9% and mining 3%. Together, these sectors account for almost a third of the economy.¹
For the headlines, the story is about factories. For credit teams, the more important question is what happens next.
How Economic Pressure Spreads Through Supply Chains
Manufacturers depend on suppliers providing raw materials, packaging, components, logistics and other services. Many of these relationships rely on trade credit, allowing businesses to receive goods or services before payment is due.
When orders decline or cash flow tightens, a manufacturer may take longer to pay its suppliers. Those suppliers still need to cover their own costs and may respond by reducing orders, tightening purchasing or delaying payments to their own suppliers.
Pressure can therefore travel through the supply chain, affecting businesses that have little direct exposure to the original manufacturer.
A payment slips by a week, then two. An account edges towards its credit limit. A long-standing customer asks for more time to pay.
None of these changes necessarily signals a crisis on its own. Together, they can prompt credit teams to investigate whether a customer’s financial position or payment behaviour is changing.
What the SA Trade Credit Industry Index Reveals
Economic figures provide an important view of South Africa’s performance, but quarterly and annual numbers can hide changes taking place within the year.
The SA Trade Credit Industry Index, Q2 2026, illustrates this clearly. Across the Trade Shield client cohort, the overdue share of the typical supplier’s receivables book moved by 5.6 percentage points between its best and worst month-ends during the twelve months to June 2026. It peaked at 33.1% in January and April before falling to 27.5% in June.²
An annual figure near 30% would not reveal the extent of that movement.
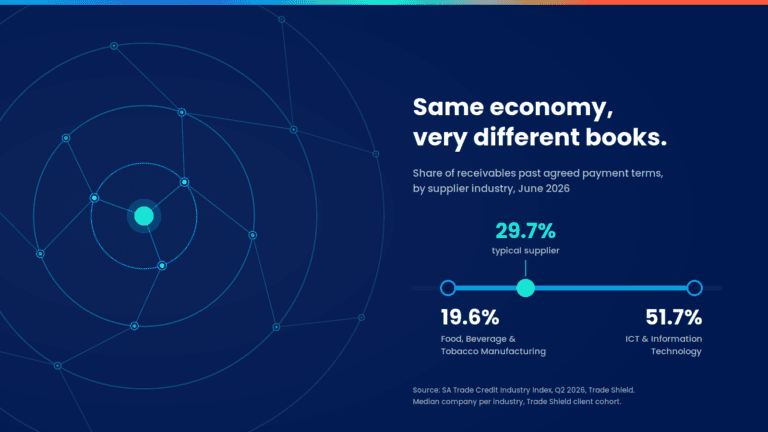
The industry picture is equally important. At June 2026, the typical supplier’s book had 29.7% of receivables past their agreed payment terms. Yet overdue receivables ranged from 19.6% in Food, Beverage & Tobacco Manufacturing to 51.7% in ICT & Information Technology.²
These figures represent the median company within each supplier industry across the Trade Shield client cohort, not the entire South African market. Nevertheless, the difference highlights why a national figure may not tell a business enough about the conditions affecting its own industry.
The Index also shows why overdue share should not be considered in isolation. For example, Wood, Furniture, Packaging & Print had one of the lowest shares of receivables at least 90 days overdue, alongside credit utilisation above granted limits. This combination illustrates why credit teams should consider multiple indicators when assessing exposure.²
The lesson is not that one measure predicts every credit problem. It is that different measures can reveal different aspects of risk.
How to Identify Early Warning Signs of Credit Risk
Supply-chain pressure does not always lead immediately to default. Credit teams can monitor five areas to identify changes that warrant closer review.
- Sector exposure
Understand which industries your customers operate in and where your portfolio is concentrated. Industry benchmarks can help identify differences in payment conditions and provide context when reviewing customer exposure.
Monitor whether customers are taking longer than usual to settle invoices. A small delay may be explainable, but a consistent change in payment patterns could indicate emerging cash-flow pressure.
- Credit utilisation and limits
Watch for customers using more of their available credit or exceeding established limits. Rising utilisation warrants investigation, particularly when considered alongside overdue balances and other risk indicators.
- Changes in ordering and payment terms
Requests for longer payment terms, unusual changes in order volumes or repeated extensions may warrant closer review. Their significance depends on the customer’s circumstances and established behaviour.
- Company events and financial information
Changes in company status and other relevant business information can provide additional context when reviewing an account. Consider these signals alongside payment behaviour, credit exposure and available financial information.
Individually, these indicators may have limited meaning. Assessed together and in context, they can support more informed credit decisions.
Balancing Credit Risk Management with Business Growth
When economic conditions deteriorate, tightening credit across the board can seem like the safest response. But treating every customer the same can mean withdrawing support from businesses that remain fundamentally sound.
Effective trade credit risk management is not simply about identifying who is under pressure. It is about understanding what the available evidence means for each credit decision.
A customer experiencing temporary cash-flow pressure may require closer monitoring or a review of payment arrangements. A customer whose underlying financial position is deteriorating may require a more fundamental reassessment of credit exposure.
Neither situation should be assessed on a single indicator alone.
A business that understands these differences can make more informed decisions about where to protect exposure, where to adjust credit terms and where continued support may be justified.
That is how credit management can support growth rather than simply restrict it. The objective is not to eliminate all risk, but to understand it well enough to make better decisions.
How Trade Credit Intelligence Supports Better Decisions
A customer’s payment behaviour tells you something about your receivables book. Industry benchmarks can help you understand how that experience compares with other suppliers in the same industry.
Trade Shield’s credit intelligence combines business-to-business payment behaviour with broader market signals to help credit teams assess emerging risk, monitor customer exposure and make more informed credit decisions.
By bringing together relevant information and industry-level benchmarks, businesses can build a clearer view of changing conditions and respond with greater confidence.
Because when pressure moves through the economy, businesses that understand what is happening have more options in how they respond.
How does your receivables book compare with your industry?
Contact Trade Shield at sales@tradeshield.ai to discuss the SA Trade Credit Industry Index and how industry benchmarking can inform your credit risk management decisions.
Sources
- Statistics South Africa, Gross Domestic Product, Second Quarter 2026, 8 September 2026.
- SA Trade Credit Industry Index, Q2 2026, Trade Shield. Figures represent the median company in a supplier industry across the Trade Shield client cohort and are not a census of the South African market. Reporting period: July 2025 to June 2026.