For years, the only way to read trade credit risk in South Africa was to look backwards.
Annual financial statements and historical reports can tell us where a business has been. But they do not necessarily show what is happening inside the trade credit market today, or how quickly conditions are changing.
That is a problem because trade credit moves faster than an annual reporting cycle.
On 9 September 2026, Trade Shield launched the SA Trade Credit Industry Index, a new benchmark designed to track business-to-business payment behaviour in South Africa at the frequency the market moves.
Its first edition covers July 2025 to June 2026, and the data reveals a simple but important truth:
The annual number can look relatively stable while significant changes are happening underneath it.
What the first Index reveals
1. Annual averages hide significant volatility
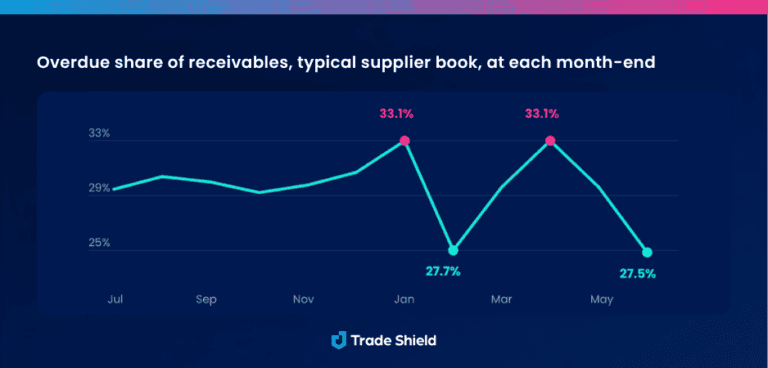
Across the Index, overdue receivables moved between 27.5% and 33.1% month to month during the twelve months to June 2026.
The two highest points came in January and April, at 33.1%. The lowest was June, at 27.5%.
That is a 5.6 percentage-point movement within a single year. Movement that disappears when twelve months are reduced to one annual figure.
April provides a useful example.
Petrol, wholesale diesel and electricity prices all moved on 1 April, but the impact was not felt equally across industries. Construction’s overdue receivables moved from 27% to 41% in a single month, while Food and Beverage showed virtually no movement.
Same month. Same country. Very different credit realities.
Looking across the full year, the differences become even more pronounced. The average industry moved 16 percentage points between its best and worst month, while half of the industries moved further than that.
Energy and Construction each swung by 28 percentage points. Food and Beverage moved by just five.
An annual benchmark could describe these industries as broadly stable.
The monthly data tells a very different story.
2. A stable headline can hide an ageing book
The headline overdue figure moved from 29.7% in July 2025 to 27.5% in June 2026.
At first glance, that does not look particularly dramatic.
Look underneath it, however, and the picture changes.
Weighted DSO, the amount-weighted age of the open receivables book, increased from 42 days in July to 46 days by December, and remained elevated, sitting at 44 days in June.
The book aged in one quarter and did not fully recover.
At the same time, protracted default, representing the share of the book sitting at 90 days or older, increased from 4.8% to 5.6% and continued to rise.
Meanwhile, default entry, the flow of accounts newly crossing the 90-day threshold, peaked in December and subsequently eased.
Taken together, the measures tell a more useful story:
Fewer accounts were entering default for the first time, but some of the older debt already on the books was taking longer to clear.
For finance and credit leaders, that distinction matters. A reduction in new defaults may look encouraging, but if existing debt continues to age, underlying exposure can still build.
3. There is not one South African credit story
The Index also highlights just how differently industries can behave.
In Q2 2026, overdue receivables ranged from 19.6% in Food and Beverage to 51.7% in ICT and Business Services.
That is a 32 percentage-point gap within one economy and one quarter.
Direction matters as much as the level.
Across the year, Construction moved 12 percentage points in the wrong direction, while Pharma moved eight percentage points in the right direction.
This matters because an industry benchmark provides context for decisions being made inside an individual business.
A supplier whose book is performing materially better than its industry median may not simply be collecting more effectively. It may have a different customer mix or a different approach to deciding who receives credit.
The quality of the customer book is itself a credit risk lever.
4. Ageing debt does not necessarily mean widespread business failure
One of the questions every credit team eventually asks is whether worsening payment behaviour means businesses are actually failing.
The Index provides some useful perspective.
Across the book, R59.3 billion in receivables is associated with companies that are deregistered or deregistering, in liquidation or in business rescue. This represents 2.2% of the book, or approximately R1.32 billion, and that share is stable and slightly falling.
The broader picture is therefore more nuanced.
Businesses are stretching payment terms and carrying older debt.
They are not, in the main, collapsing.
That distinction changes the response. If the problem is widespread failure, the priority is defensive: reduce exposure and protect cash.
If businesses are stretching while remaining operational, there may be an opportunity to understand which customers are worth continuing to support, where exposure can safely grow and where early intervention is needed.
Credit intelligence should help businesses make both decisions.
Better buyers, not harder chasing
Perhaps the most commercially important insight from the Index is that a healthier receivables book is not necessarily created by chasing harder.
It can start with who you choose to sell to.
If a company’s receivables consistently outperform its industry benchmark, that may reflect the quality and composition of its customer portfolio as much as its collections process.
This creates a different way of thinking about credit.
Instead of asking only:
How do we collect this debt faster?
Businesses can also ask:
Which customers are worth extending credit to, and where can we safely grow?
For finance and sales teams, that turns credit intelligence from a defensive function into a commercial decision-making tool.
The data behind the Index
The first edition covers 14 industries across July 2025 to June 2026.
The underlying data provides a view of the market that individual businesses cannot create from their own books alone:
- 250,000+ South African businesses monitored daily
- 4.6 million trade lines received across the twelve month ends
- R130 billion in open trade credit at the June 2026 month-end
The Index is built around four principles:
Quarterly, not annual. Trade credit conditions can change materially within a year, so the Index is measured monthly and published quarterly.
The median company, not the biggest book. Each contributing company counts once, preventing a small number of large receivables books from disproportionately influencing an industry benchmark.
Like-for-like measurement. Consistent measurement makes it possible to understand movements over time rather than treating individual figures in isolation.
Better buyers, not simply harder chasing. The benchmark helps businesses understand not only how their collections are performing, but whether their customer portfolio is contributing to a healthier book.
A view from the market
The Index was launched at the Trade Shield Executive Insights Breakfast in Johannesburg, where finance and credit leaders explored what changing payment behaviour means for businesses navigating a more complex trading environment.
DHL joined the launch to share a real-world perspective on managing credit across a global supply chain.
Tanja Shackleton, Credit and Collections Head, Global Forwarding MEA at DHL, highlighted the importance of using credit data to support broader commercial decisions:
“As a Trade Shield user, I’ve seen how the platform supports our risk analysis, helps us understand credit use and identify our best-paying customers. That insight can then be shared with sales to identify opportunities for growth.”
Her perspective reflects a broader shift in the role of credit. Finance, sales and operations need to work together to identify changes in customer behaviour before they translate into financial exposure.
The launch was also covered by Engineering News, which explored how the Industry Index can help businesses sharpen their approach to trade credit risk.
What is next?
This first edition is not a once-off report.
The commitment is simple:
Measured monthly. Published quarterly. Built to expand.
The Index will continue to track changes in South African trade credit conditions and expand its industry coverage over time.
The first edition covers 14 industries, but South African trade does not stop at 14. Building coverage for additional industries starts the same way every index begins: with real trade credit data and businesses willing to contribute to a better market benchmark.
See where your book sits
An annual number gives you one point in time.
A year of business conditions is a moving picture.
The SA Trade Credit Industry Index is designed to show finance and credit leaders how payment behaviour is changing, where their industry sits and whether their own receivables book is moving with or against the market.
Want to understand where your book sits against your industry benchmark? Talk to Trade Shield.
We will show you what the latest Industry Index says about your market, where your own book sits against it and, if your industry is not covered yet, what it would take to get there.
A look back at 9 September 2026, the room, the data, and the conversations that got started.